

Regardless of the many technological leaps made over the past decade, firms in the healthcare, insurance, and finance sectors still deal with a staggering amount of paperwork. Because of the lack of unified data platforms, it is still a common practice to use paper documents when there is a need for ad hoc data transfer between organizations. This is especially true in the case of insurance companies in India, which require you to attach medical records from hospitals with the claim request forms.
The receiving organization employs people to read through hundreds of pages to identify the data that is needed for decision-making. While a unified central data platform shared across industries is the most elegant solution to this, we are not close to achieving that yet. In such instances, domain-specific applications that can extract relevant information from paper documents can help reduce the human effort to a large extent. This article discusses the solution architecture of an application designed specifically for extracting information from clinical laboratory reports.
System Requirement
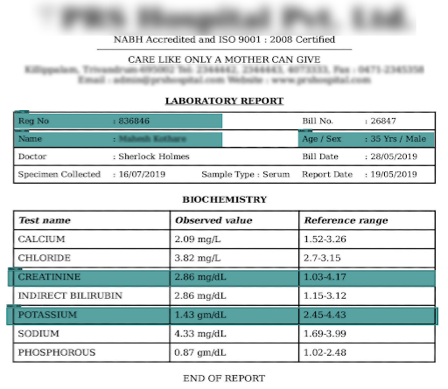
Our objective was to build a system that can extract relevant information from reports issued by clinical laboratories. It is pretty easy to build a system that works on a single format, but such a system will not be of much use to an organization that deals with a variety of reports from different laboratories. Our system had to be generic enough to work with reports in most of the common formats. Some of the sample inputs we started with are given below.
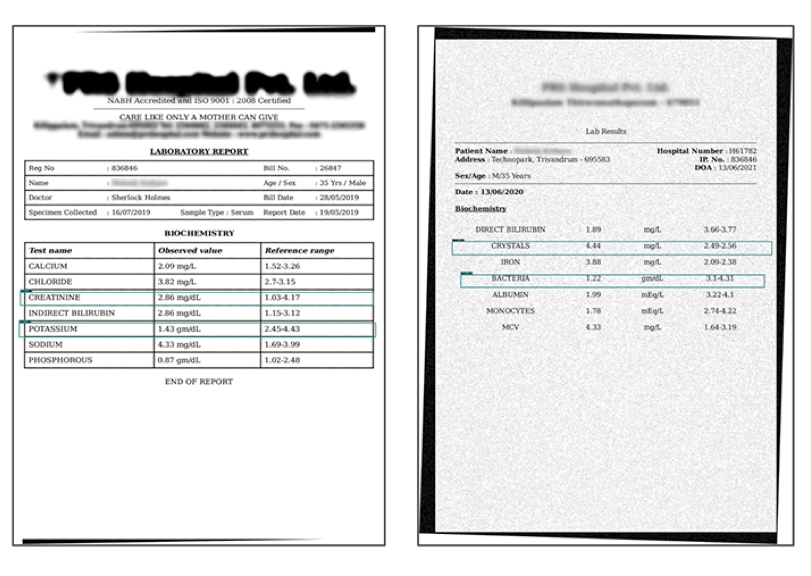
From the above reports, we wanted to extract the following information:
- Patient ID
- Name of the patient
- Age of the patient
- Gender of the patient
- Tests and the results
1. Research and Review
A coordinate-based template extraction system seemed like an obvious solution at the outset. Coordinate-based extraction systems work based on the principle that once the x,y coordinates of a relevant text field are known, we can use the same to extract the field from other documents as well.
The problem is that reports don’t have a standard format. Even reports for the same tests are different when issued by different labs. Because of this differentiation, a one-size-fits-all template was out of the question.
We finally decided to go with a system that can localize the relevant fields of information in a report, that is, it would detect an entity in the document and get its coordinates. In our case, it would be the patient ID, name, age, gender, and lab tests and results. That took us to the next step: object detection.
Object Detection
There are many deep learning-based object detection models that can detect a variety of objects from an image, such as a cat, dog, bicycle, person, etc.
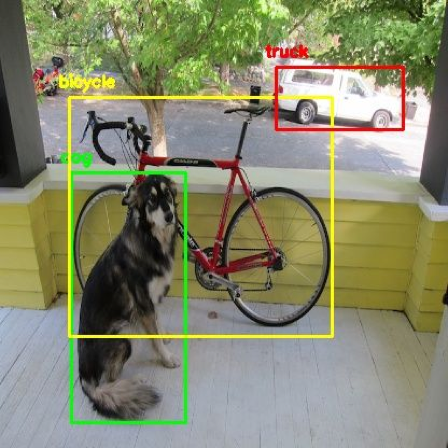
But in our case, we required more. The question was whether we could use the ability of the object detection models to locate and tag a relevant object in an image and generate their coordinates.
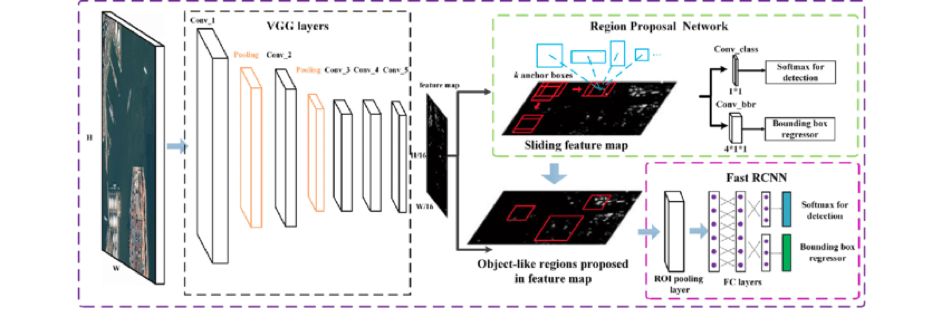
Faster R-CNN Object Detection Model
After assessing various state-of-the-art object detection models, we decided to move forward with Faster R-CNN object detection models, which have the highest proven accuracy.
Transfer Learning in Object Detection
Transfer learning is a technique in deep learning to transfer the knowledge acquired by a model to a similar use case—exactly what we needed now. We used Faster R-CNN models that are trained in the COCO dataset, which has around 1,23,000 samples.
2. Divide and Conquer
We decided to use two models: one to detect patient details and another to detect test details from the lab reports. The Patient Details model will detect the patient ID, name, age, and gender. The Test Details model will detect the test names and results.
3. Architecture Finalization
After the initial research and literature review, we arrived at four modules or subsystems with independent responsibilities:
- Pre-processing module
- Object detection module
- Optical Character Recognition (OCR) module
- Post-processing module
Such a design will allow us to upgrade these subsystems without affecting others.
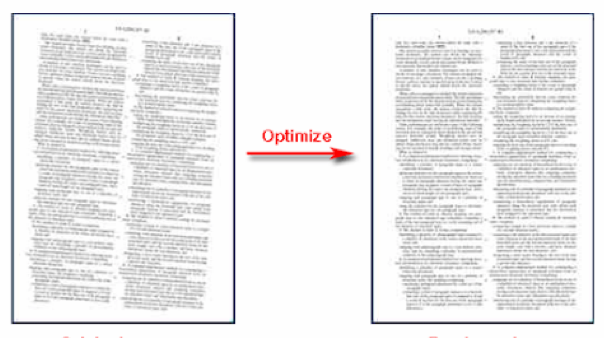
Preprocessing Module
This module improves image quality so that the downstream modules can do a better job of processing the images. It converts all the input documents into a standard TIFF image format that the object detection models can process. It uses OpenCV, an open-source image processing library, internally to do its job. The OpenCV library has built-in methods to convert various file formats to TIFF. Any skewing errors in the scanned documents are fixed so that the subsequent module gets a cleaner image to process.
Object Detection Module
The preprocessing module’s output is directly fed to the models. The trained models predict the location coordinates of the fields. The fields identified by the object detection model are cropped using OpenCV-based functions for further processing. The output of both the Patient Details model and Test Details model are given below.


Optical Character Recognition (OCR) Module
We used Google’s open-source OCR engine, Tesseract, to extract the information. We did some basic preprocessing techniques like image thresholding and binarization to enhance the OCR process. The cropped images were passed to the OCR engine.
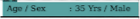
Tesseract, by default, treats the input image as a full page. But in our case, we were only feeding it with cropped bits of the image from a page, and that created problems in text extraction.
Tesseract has a configuration parameter Page Segmentation Mode (PSM), which enables Tesseract to view the input image as a single line of text, a single word, or a single character. We used Page Segmentation Mode 7 (Treat the image as a single line of text) and got optimal results.
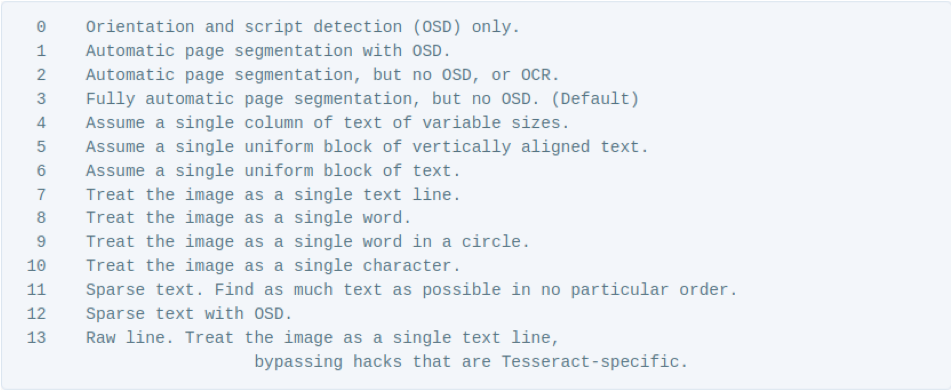
Post-Processing Module
The post-processing module's job is to implement any domain-specific business logic based on the inferred information. It also serves as a gatekeeper to capture any obvious error that can be detected using domain knowledge. This way it helps in improving the overall accuracy of the system. In this case, the post-processing module handles the text output from the OCR module and implements a business logic to detect and flag the test results that do not conform to the normal range as per the report. Such values are highlighted in red to invite the attention of the decision-maker responsible for adjudicating the claim. This module also has intelligence built in to detect any errors caused by OCR failure. This is accomplished using the built-in domain knowledge about the typical ranges of specific test types that the system is designed to process.
To train the Patient Details model, we annotated only the name, age, and gender in the reports, and to train the Test Details model we annotated only the test details in the reports. The training took around 12 hours for each model. On evaluation on the test set, we got an mAP of 91% (0.91mAP@0.5IoU) for the Patient Details model and 89% (0.89mAP@0.5IoU) for the Test Details model. We finally had our models localize the relevant fields in the report with an average of 90% accuracy.
4. Training and Evaluation of Object Detection Models
Data Labeling
To teach/train an object detection model, we first needed to annotate or label the lab reports. We annotated all the required fields (as shown in the example below). For this, we used the free and open-source tool labelImg.
Thus we created the dataset for an object detection model that can detect the patient and test details from medical lab reports.
Model Training
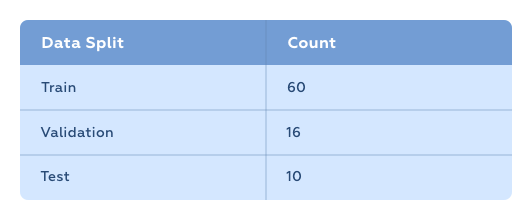
Once we labeled the data, we split it into three:
- Training set (70%)
The training set of images is the one from which the model learns. In our case, the model adapted the knowledge it acquired while training on the COCO dataset to our use case.
- Validation set (20%)
During training, the model evaluates itself at certain intervals to ensure that the training process is running correctly or the model is learning as expected. The validation set is used for this evaluation.
- Test set (10%)
After the model training is complete, the model is evaluated on data that it has never seen during the training process. For this, the test set is used.
We collected 86 sample medical reports and split them up as follows:
The training was done using the GTX 1060 GPU. It took around 12 hours to complete.
Model Evaluation
We used Mean Average Precision (mAP) to evaluate the object detection models. Mean average precision is the mean of average precisions of all the classes of the model. To evaluate our model, we chose the metric mAP@0.5IoU.
Once the training was over, the model had an mAP of 98% (0.98mAP@0.5IoU). We evaluated the model on our test set and found out that our model had an mAP of 67% (0.67mAP@0.5IoU, which was not bad to start with). Examining the validation set accuracy and test set accuracy of our models, we understood that the models are clearly overfitting the data. (This happens when the model memorizes the training data as a whole instead of learning patterns from it. In such cases, the model will perform extremely well while training and perform very poorly on testing. The case of overfitted models can be clearly identified when the validation set accuracy is much greater than the test set accuracy.)
So we needed to add more training samples to the training set.
Data Augmentation
One of the ways to expand the training set is data augmentation or the creation of slightly modified copies of existing data. We applied the following image augmentation techniques to the existing images:
- Rotation: Randomly selecting a set of images from the training set and rotating them a few degrees clockwise and counterclockwise gives us new copies of the same report.
- Translation: Translation involves moving the image along the X or Y axis (or both).
- Gaussian Noise: Adding Gaussian noise to the training images is an excellent way to prevent overfitting of the model since the model won’t be able to learn and memorize pixel frequency patterns.
Applying different combinations of these augmentation techniques on our dataset of 86 samples helped us to create a dataset about three times its original size. Then we split the data into Training, Validation, and Test sets in the ratio mentioned earlier.
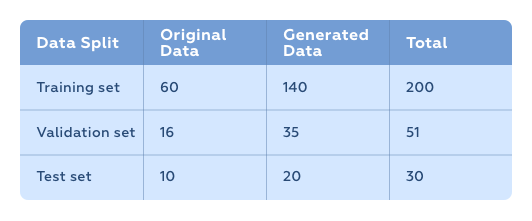
We used this augmented data to retrain our model. We got an mAP of 86% (0.86mAP@0.5IoU) in the test set.
Conclusion
The system we created is capable of automating digitization of not just lab reports, but any kind of paper documents like invoices, purchase orders, receipts, reports, etc. This implementation is done specifically for the insurance industry and considers only laboratory reports. The overall modular nature of the architecture ensures that the design can be fine-tuned for other industries. The modularity also ensures that the subsystems are independently upgradeable when there are more advancements in the deep learning space or when we have more data to train them. For example, we can create our own OCR deep learning solutions and plug them instead of Tesseract.