

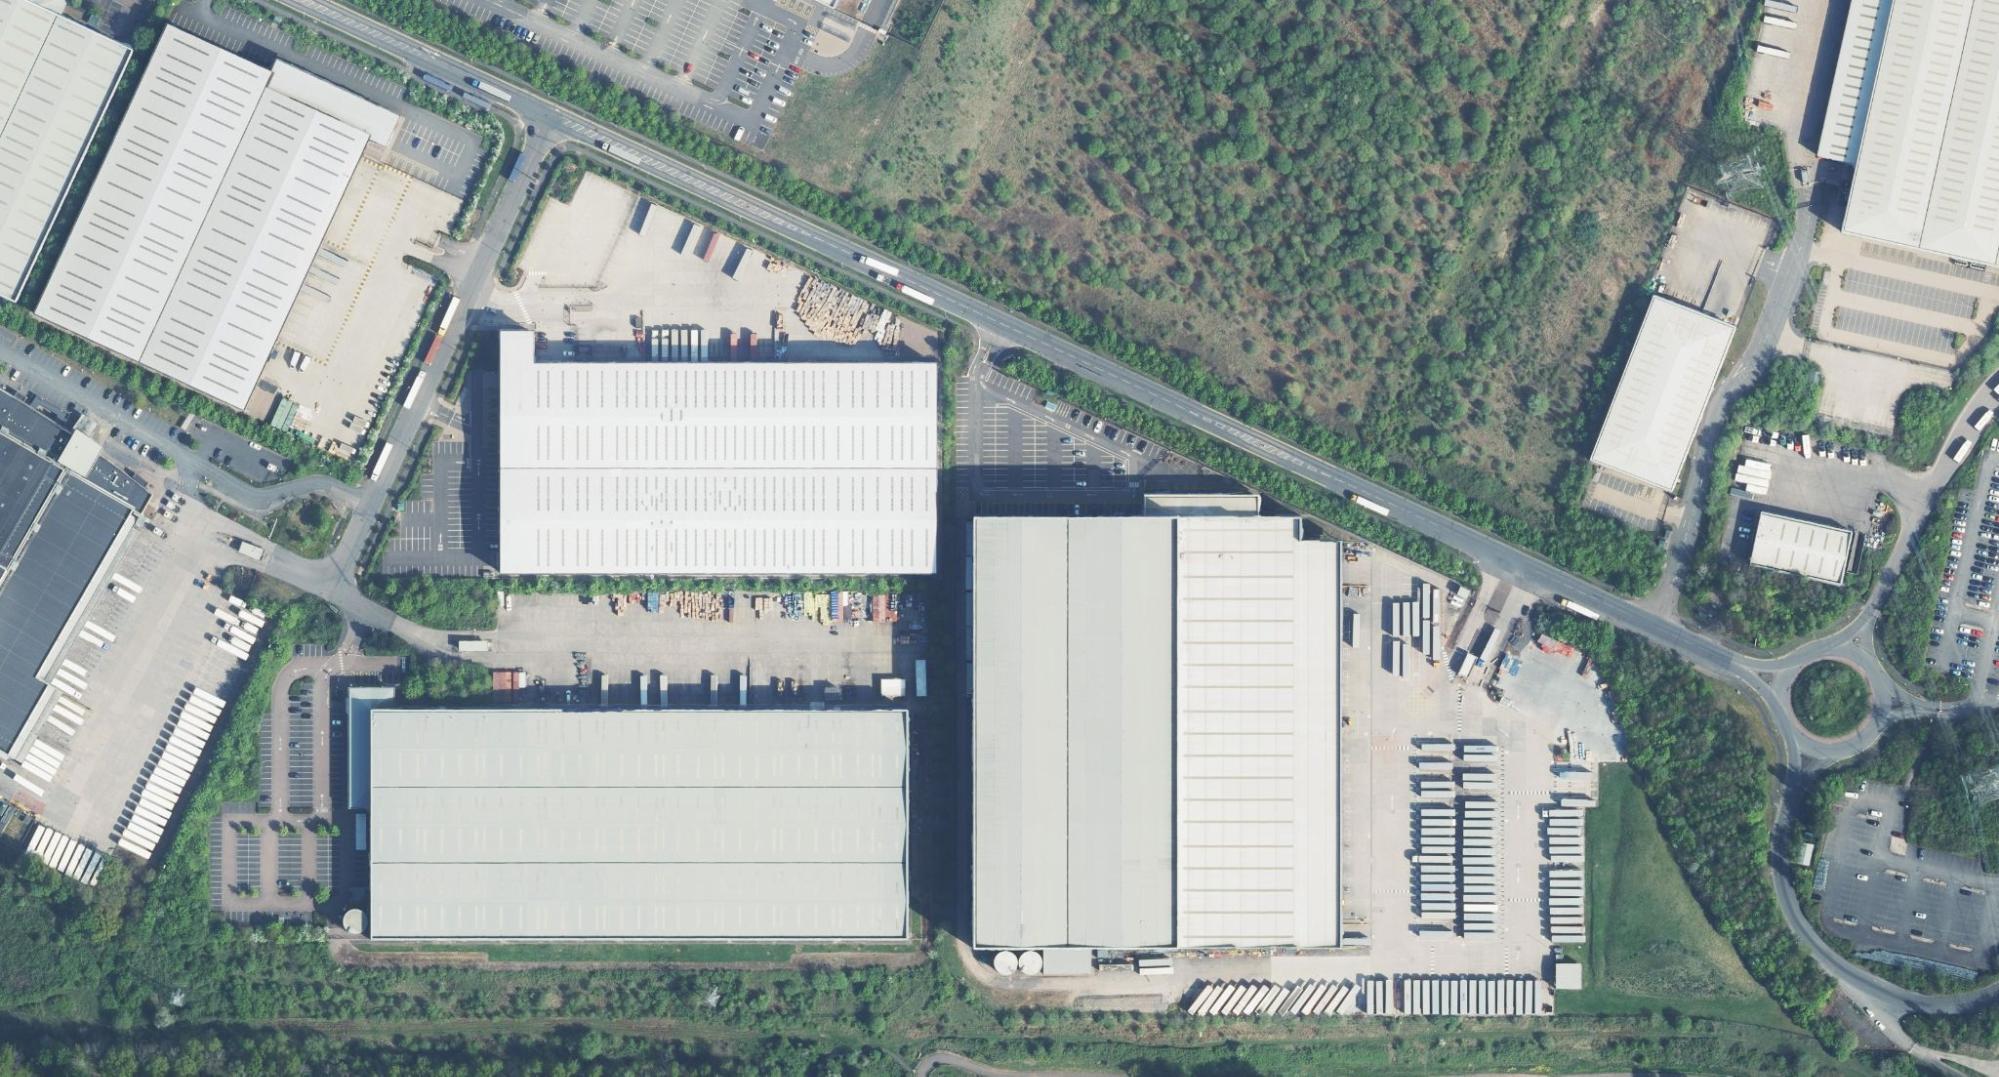
Our client works in outdoor estate maintenance, where accurate site estimations are important for quoting service costs.
The team relied on satellite imagery for this, spending hours drawing polygons around fields, vegetation, and built-up areas, and then using built-in tools to calculate surface area.
While this method worked, it wasn’t scalable. Depending on the size and complexity of a site, a single map could take anywhere from 10 to 30 minutes to complete. With tens of thousands of sites to manage each year, it could quickly become daunting.
We set out to design a solution that could automatically detect and draw polygons around areas of interest, cutting down the manual work and making large-scale site estimation practical and efficient.
Understanding the Workflow
Our goal was simple: replicate the manual Google Earth process with automation. But building that workflow step by step turned out to be quite the journey.
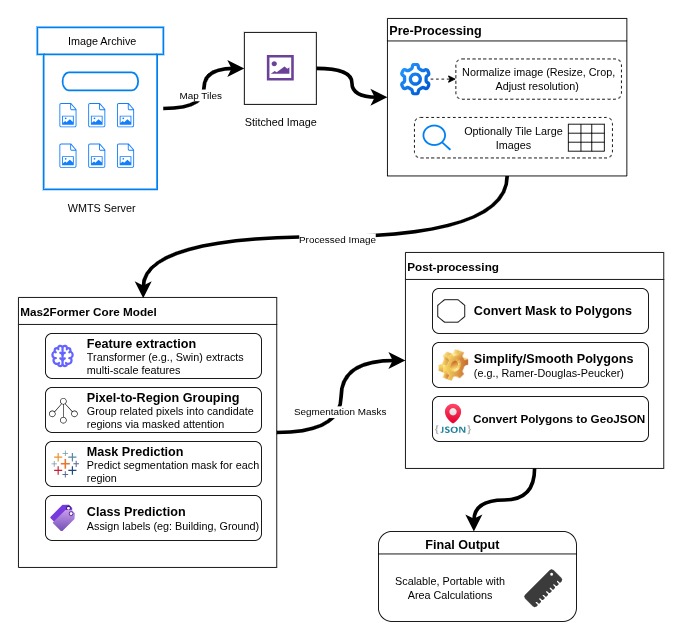
The first problem we faced was data. We couldn’t rely directly on Google Earth or Google Maps, since their APIs don’t allow extracting imagery the way we needed it. So our starting point was figuring out how to generate map tiles as standalone images, which could then be processed with machine learning models.
Experiments with Vision-Enabled LLMs and Classical CV Models
We tested vision-capable large language models like Gemini 2.5 Pro, GPT-4o, and Claude 3, curious if they could help us identify regions directly. While these models are great at describing images, they struggled with satellite data. They could tell us there was vegetation but couldn’t draw accurate boundaries around it. So we quickly learned LLMs weren’t the right fit here.
Next, we explored open-source platforms like Hugging Face. Two models stood out:
- Segment Anything Model (SAM) for segmentation.
- Grounding DINO for prompt-based object detection.
Grounding DINO gave us bounding boxes for objects like “building” or “open ground,” and SAM refined those regions into segmentation masks. This combination worked well for structured objects such as buildings, but it had a harder time with irregular shapes like open fields or greenery, where edges blend into surroundings.
Finding a Better Fit with Mask2Former
After experimenting with different segmentation techniques, we realized we needed more than just boundaries. What we really needed was a model that could both separate regions and understand what those regions represented. We found a stronger candidate in MaskFormer and its successor, Mask2Former, developed by Meta.
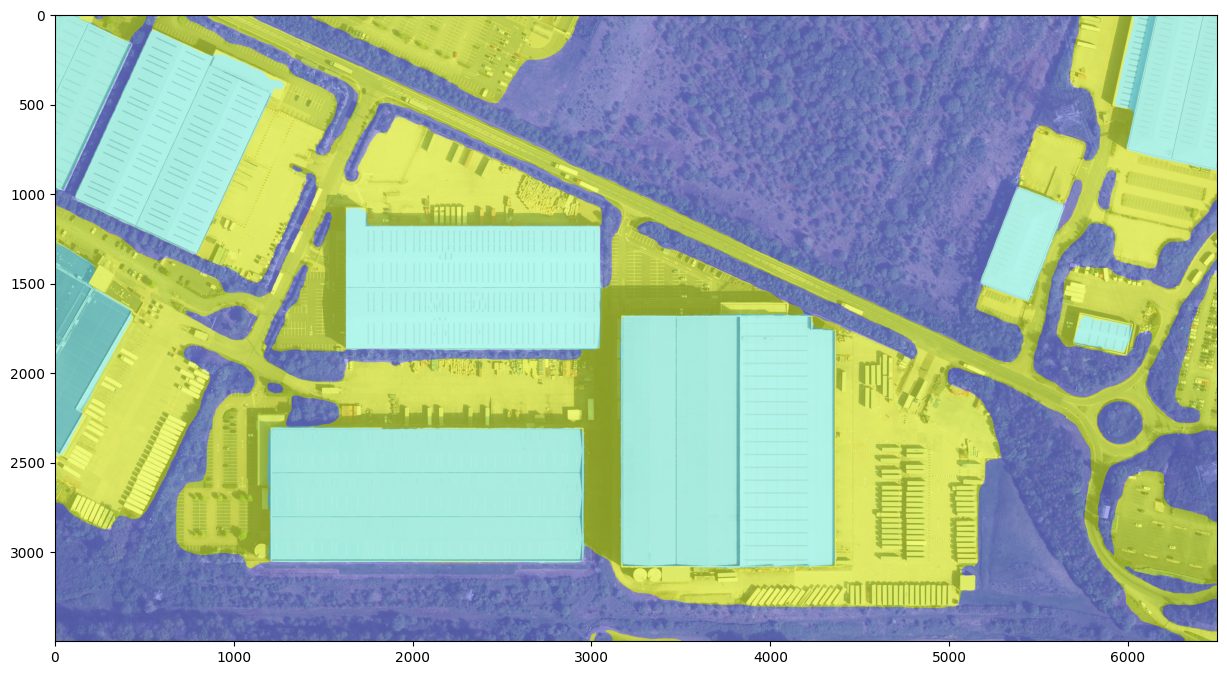
While most traditional models work at the pixel level, classifying every pixel independently, Mask2Former takes a more holistic approach. It groups pixels into coherent regions (masks) and then assigns each region a label. So instead of simply drawing shapes, it can tell you, “this is a rooftop,” “this is vegetation,” or “this is ground.”
In our use case, this was a big step forward. It meant we didn’t have to juggle multiple models, which had to work together to detect and then segment. With Mask2Former, we could rely on a single model to provide clean, labeled masks directly from satellite images.
Another advantage was flexibility. Mask2Former supports semantic, instance, and panoptic segmentation, which means it can be adapted depending on the granularity needed, from broad categories like “green area” to individual trees or buildings.
In practice, even without fine-tuning, Mask2Former performed surprisingly well on rooftops and vegetation. Grounds were trickier since the base model was trained on ADE20K and not specifically on satellite imagery, but with fine-tuning on domain-specific datasets, we saw clear potential for high accuracy.
Mask2Former’s efficiency was another practical advantage. It’s lightweight enough to run on a CPU and delivers inference results within a few seconds per image. With GPU, the inference feels seamless, almost like a regular image processing task rather than a heavy machine learning operation, making it well-suited for scenarios where speed and scalability are important.
Fine-tuning the Model
To improve accuracy, we needed to train the model on data that reflects our specific use case.
Mask2Former is built on PyTorch and supports fine-tuning with datasets in the widely used COCO format. We prepared a custom dataset of satellite images, manually annotated with polygon masks for categories like building, ground, vegetation, and so on.
Fine-tuning involved:
- Formatting the dataset into the right structure (images, masks, and annotations).
- Updating the model configuration with our custom classes.
- Training the model on a GPU setup to learn these specific patterns.
Once trained, the fine-tuned model performed significantly better on our data. It correctly identified open lands, even when they appeared in irregular shapes or had mixed textures. This brought us much closer to a solution that could replicate the manual polygon-marking process faster and at scale.
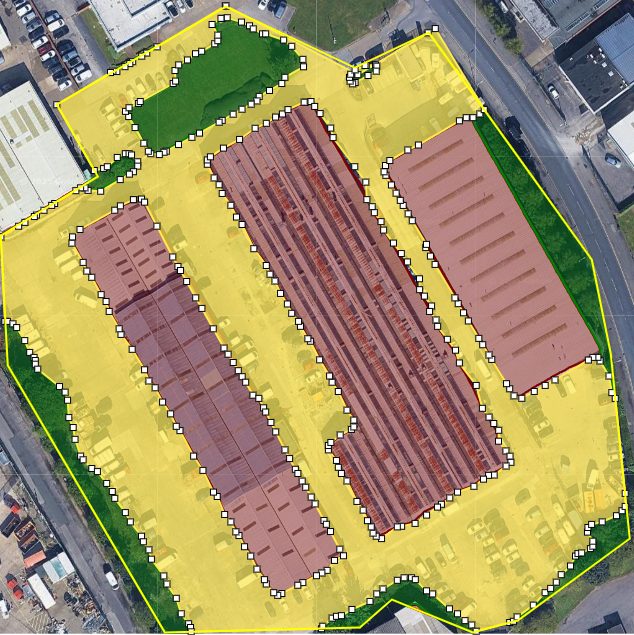
From Masks to Usable Polygons
Now that we had a reliable way to segment objects from satellite images, the next challenge was to convert the segmentation masks into clean, usable polygons and eventually into a GeoJSON format because polygons are what mapping tools and GIS systems understand.
Segmented masks are essentially pixel-wise binary maps; each pixel tells whether it belongs to a class or not. But to make this output portable and usable, especially in applications like Google Earth or GIS dashboards, we needed to turn the masks into vector data—polygon shapes with real-world coordinates.
Since we were working with 30 cm resolution imagery, we could easily compute the real-world area covered by each polygon. Once we had the pixel area, converting it to square meters was just basic math.
Post-Processing: Making the Polygons Smoother
The raw polygons extracted from segmentation masks tend to be messy. Satellite images are noisy by nature, objects have soft or broken edges, and the segmentation model might add extra pixel-wide wiggles or rough contours around the boundaries. This results in polygons with hundreds or even thousands of points, some of them redundant, and irregular jagged edges.
Rendering or storing such polygons directly is inefficient and makes visualization slower, especially when handling hundreds of shapes. So, we needed to simplify the polygons while preserving their shape and accuracy.
Smoothing with Ramer-Douglas-Peucker
The Ramer-Douglas-Peucker (RDP) algorithm is a well-known line simplification algorithm used in computer graphics and cartography. It works by reducing the number of points in a curve that is approximated by a series of line segments, based on a specified tolerance value.
We applied RDP to:
- Straighten zigzag edges
- Reduce the number of points in each polygon
- Keep the overall shape and area fairly accurate
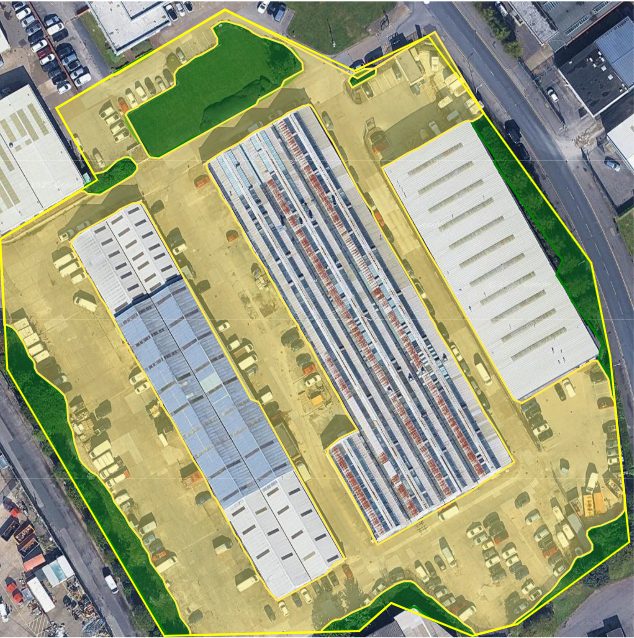
The beauty of RDP is that it allows us to fine-tune how much simplification we want. A higher tolerance gives simpler polygons but may lose detail, while a lower value retains more shape fidelity. After testing various thresholds, we found a balance that worked well for both buildings and grounds.
This not only reduced polygon vertices but also made the shapes look cleaner and more realistic, closer to what a human would have drawn on Google Earth.
Converting to GeoJSON and KML
Once we had clean, simplified polygons, we converted them into GeoJSON, a lightweight, human-readable, and widely accepted spatial format supported by almost every GIS and web mapping platform.
But since our client was familiar with Google Earth, we also generated output in Keyhole Markup Language (KML). This format is especially well-supported in tools like Google Earth (Desktop and Web), QGIS, ArcGIS, and web-based map viewers.
By delivering results in familiar formats like GeoJSON and KML, we not only ensured technical compatibility but also business continuity, as teams could continue their work without retraining or workflow changes.
The Hours-to-Seconds Efficiency Gain in Site Mapping
By replacing the manual polygon-drawing process in Google Earth with an AI-driven segmentation pipeline, the client gained significant efficiency and scalability. The system has reduced the client’s site preparation time from hours to mere seconds per site. This key shift allows the team to handle a much higher volume of requests during peak seasons without needing extra staff. Beyond that, the solution is scalable and future-ready; it integrates with their backend systems for a smooth, all-in-one workflow.
Summary
In this post, we shared our journey of building a machine learning pipeline to automate a previously manual process—identifying and measuring grounds and green areas from satellite imagery.
Traditionally, this took hours in Google Earth, with teams drawing polygons and calculating areas site by site. A single site could take 10–30 minutes, making large-scale mapping slow and costly.
Our solution transformed a slow, manual mapping process into an automated, AI-driven workflow that identifies and measures grounds and green areas in seconds. What once took hours in Google Earth now happens instantly, allowing teams to handle far more site estimations without extra effort. The system reduces manual work, improves accuracy, and ensures consistent, reliable outputs that make project planning faster and more efficient.
The impact goes beyond speed; it delivers true scalability. Site preparation teams can now process imagery in bulk, generating accurate, ready-to-use polygons in GeoJSON or KML for seamless integration with Google Earth and other GIS tools.
The result is a streamlined workflow that frees teams to focus on higher-level planning instead of repetitive polygon drawing. Currently, only minimal human input is needed to mark the initial site boundary. As our computer vision models mature, even that step will be automated—moving toward a fully autonomous estimation process where human effort shifts from mapping to validation and strategy.