


It is very hard to monitor logs of large environments using manual log monitoring. In such situations, we need to use centralized and near real-time log monitoring systems. This will help in detecting and resolving anomalies as soon as they occur. Among log monitoring tools, Elastic Stack is the most popular one. As an open-source solution, Elastic Stack provides some basic features. Premium features such as enhanced security, authentication mechanism, alerting, reporting, and machine learning come with Elastic Stack Features (formerly X-Pack) license.
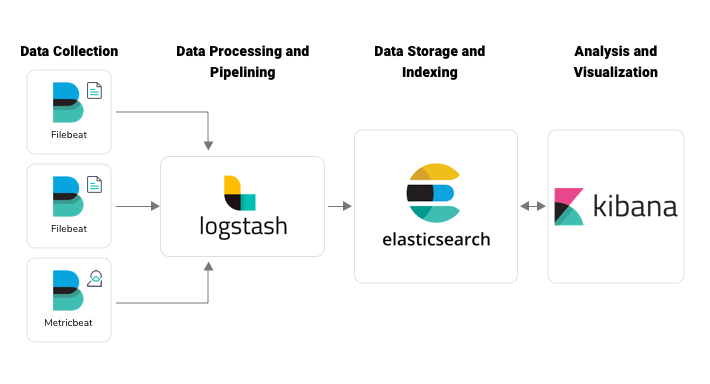
Elastic Stack started out as ELK Stack, a combination of three open-source products: Elasticsearch, Logstash, and Kibana. When Beats was added to the ELK Stack, it was renamed as Elastic Stack. Elasticsearch is an open source full-text search and analytics engine based on the Apache Lucene search engine. It is distributed, multitenant, RESTful, JSON-based, and capable of providing near real-time search results. Logstash is the data processing pipeline that collects data from different sources, transforms, and transports it to various supported destinations. Kibana is the visualization layer that offers dynamic and interactive visualization features like histograms, line graphs, bar graphs, heat maps, sunbursts, and more. Beats are lightweight data shippers that collect data from the systems and forward it to the stack.
Key Concepts in Elasticsearch
You have to be aware of the basic concepts of Elasticsearch in order to configure a stable monitoring environment using Elastic Stack. In Elasticsearch, data is organized as clusters, nodes, index, shards, replicas, type, and document.
An Elasticsearch cluster is a collection of nodes (servers) that holds the entire data. The cluster provides the indexing and search capability over multiple nodes. An Elasticsearch node is a single server. A part of the cluster stores data and participates in the process of indexing and search. Index is a collection of documents having similar characteristics. In a single cluster, you can create multiple indices. An index can be divided into multiple shards. Each shard acts as an index, and shards are distributed over different nodes. Elasticsearch can keep multiple copies (replicas) of shards called primary shard and replica shards. Sharding, along with replicas, helps in splitting the information in multiple nodes, scaling the application, and parallel processing. An individual data available in the Elasticsearch index is called a document. “Type” is used as a logical partition of index, but, as of now, this field is deprecated.
Configuring Persistent Queue in Logstash
In Logstash, there are chances for crash or delivery failure due to various reasons like filter errors or cluster unavailability. This can lead to data loss in the log monitoring system. To guard against such data loss, Logstash (5.4 onwards) provides data resilience mechanisms such as persistent queues and dead letter queues.
In the default configuration, Logstash keeps the log data in in-memory queues. The size of these in-memory queues is fixed and not configurable. As the primary memory is volatile, in case of machine failures, the data in the memory queue will be lost. If we enable the persistent queue mechanism in Logstash, the message queue will be stored in the disk. Enabling this feature helps in removing additional architectural modification by adding some buffering layer before Logstash pipelines. Also, this assures log delivery even in the case of system shutdown, restart, or temporary failure.
Persistent queue works in between the input and filter section of Logstash. To configure persistent queue-enabled Logstash, we need to update the logstash.yml.
queue.type: persisted
path.queue: "path/to/data/queue"
queue.max_bytes: 4gb
In addition to persistent queue, we can use dead letter queue to store write failed events, process them, and place them back in the Elasticsearch index. This feature works only in the Elasticsearch output option. For configuring this change, we need to add the following configuration settings in the logstash.yml file. Also, we can define the size of the dead letter queue by setting dead_letter_queue.max_bytes. The default value is 1gb. Logstash has the dead_letter_queue input plugin to handle the dead letter queue pipeline.
dead_letter_queue.enable: true
path.dead_letter_queue: "path/to/data/dead_letter_queue"
dead_letter_queue.max_bytes: 2gb
Other Message Queueing Options
We can ensure data resilience by using Logstash persistent queuing mechanism in small environments with a low volume of logs. But in the case of log monitoring systems that handle a large volume of logs, we need to add some message queueing mechanism in between Beats and Logstash. Three commonly used tools for message queueing are Apache Kafka, Redis, and RabbitMQ.
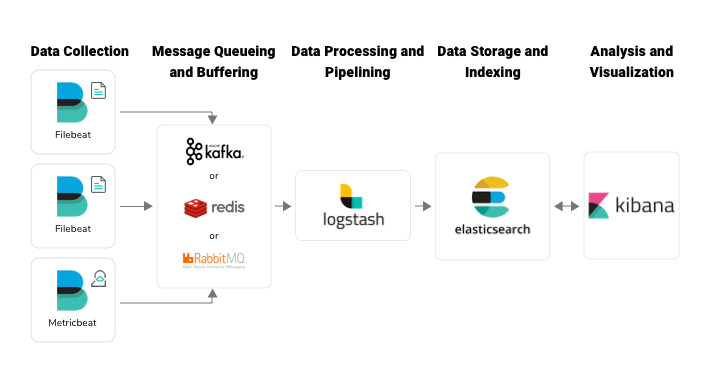
Apache Kafka: Apache Kafka is a distributed streaming platform that can publish and subscribe to streams of records. The components that generate streams (here logs) and send them to Kafka are the publishers (here it is Beats) and the components that pull logs from Kafka are the subscribers (here it is Logstash). Kafka stores data in different topics. Each topic has a unique name across the Kafka cluster. The publisher can write messages to Kafka-topics and consumers can consume data from the Kafka-topics.
Redis: Redis is an open-source, in-memory data store that can be used as a message broker. It stores data as key-value pairs. Redis is really fast as it uses in-memory data store. On the other hand, it becomes a weakness when memory is full. Log data will be dropped when the Redis queue is full. Redis also offers disk-based data persistence to avoid data loss, but the performance will be reduced due to disk latency.
RabbitMQ: RabbitMQ is an open-source enterprise message queueing system based on Advanced Message Queueing Protocol (AMQP) written in Erlang. In RabbitMQ, we have brokers, producers, and consumers. Brokers are responsible for tracking which messages are delivered to which consumers. RabbitMQ is a good choice when you have less than thousands of logs per second.
Elastic Stack without Beats
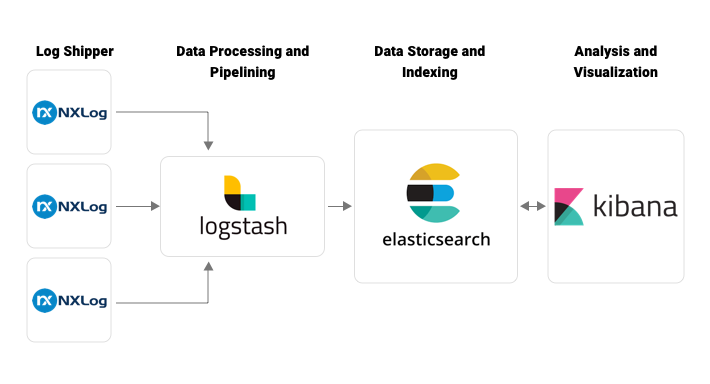
In the basic Elastic Stack architecture depicted in Fig 1 and Fig 3, different kinds of Beats applications are used as log shippers, such as Filebeat, Metricbeat, Packetbeat, Winlogbeat, etc. According to Elastic support matrix, some operating systems like AIX and Solaris don’t support Beats application installation. So we can’t implement Beats-related architecture in such platforms. The solution to this problem is to use another log shipper instead of Filebeat. NXLog is a good alternative. NXLog can transfer logs to either Logstash or Elasticsearch.
Let’s discuss the first approach: NXLog used as log shipper to Logstash. To establish communication between NxLog and Logstash, we need to configure nxlog.conf and logstash.conf appropriately. For configuring NXLog to read from the file, we need to use “im_file” module. And to output to Logstash, we need to use “om_tcp” module. Also, we need to add some configurations based on the log behavior for handling multiline logs, logging, parsing the logs, adding additional information, and JSON parsing. A sample configuration is given below.
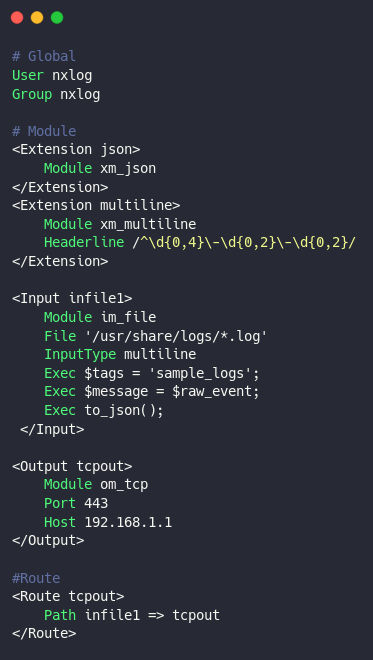
Fig 5. NxLog sample configuration
The NXLog configuration has three sections: Global, Module, and Route. The Global section has the directives that control the overall NXLog configuration behavior. The Module section holds the different modules to be loaded into the NXLog execution. It contains the configurations using Extension, Input, Processor, or Output. The Routes define the flow and processing order of the log messages. Each route instance must have a unique name and a path. This configuration reads logs from the “/usr/share/logs/” directory having “.log” extension. With the xm_multiline module, NxLog identifies the start of a new log event by using the date (normally log messages start with date). Also, we can add some additional information along with the log message. In the Input section, we have added some information in the Tags field. These tags can be later used to identify the log source. Copy the exact log message to the field named ”message” and convert the whole data into json. Thus we can configure log input from multiple sources and multiple destinations. Finally, connect the path with input and output.
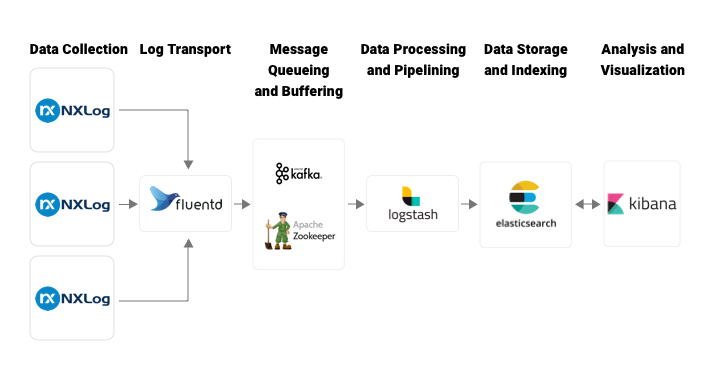
This configuration works only with the basic Elastic architecture depicted in Fig 1. If we introduce Apache Kafka as a message buffering and queueing layer in the architecture, NXLog has a module om_kafka to communicate with Kafka. But unfortunately, om_kafka module is not compatible with operating systems like IBM AIX and Solaris. So we need to introduce another layer in the architecture, Fluentd. As Fluentd is introduced to the architecture, we need to modify the output section in the NxLog configuration described in conf 3, update the host, and port values with the corresponding host and port values of Fluentd.
Alternative to Metricbeat
In AIX servers, we can’t access system performance details using Metricbeat. But since system performance monitoring is important, we need to find an alternative to incorporate system metric data into the centralized monitoring system. With the help of nmon or topas_nmon tools, we can collect system metrics logs. We just need to run a cron job to capture system metrics in a file with a specific interval in a comma-separated format, by using the following command:
0 0 * * * /opt/nmon/nmon -f -s 60 -c 1440 -T -m /opt/nmon/nmon_logs/It will create files with the extension “.nmon” in the “nmon_logs” directory. You can configure NXLog to read data from the file and process it by Logstash. The first few lines give the basic details of how to identify the log lines, the system configuration details, and system performance metrics. Sample data is shown below (Note: Only some log lines are included).
AAA,time,15:05.25
AAA,date,29-AUG-2019
AAA,interval,10
AAA,snapshots,10
AAA,cpus,4
CPU001,CPU 1 SGSCAIU0764,User%,Sys%,Wait%,Idle%
CPU_ALL,CPU Total SGSCAIU0764,User%,Sys%,Wait%,Idle%,Busy,CPUs
ZZZZ,T0001,15:05:27,29-AUG-2019
CPU001,T0001,1.5,3.7,6.0,88.8
CPU002,T0001,3.0,3.7,0.0,93.3
CPU003,T0001,2.3,3.0,12.8,82.0
CPU004,T0001,0.8,1.5,0.0,97.7
CPU_ALL,T0001,1.9,3.0,4.7,90.4,,4
MEM,T0001,7808.3,-0.0,-0.0,3072.0,162.5,-0.0,-0.0,1984.2,-0.0,1444.6,3334.9,-1.0,0.3,253.6,3773.6
NET,T0001,4.1,0.0,0.2,0.0,4.1,0.0,0.2,0.0
NETPACKET,T0001,54.9,0.0,3.0,0.0,54.9,0.0,1.5,0.0
We have to use Logstash aggregate filter plugin while parsing these logs because log time is kept only in one line as we can see in the logline starting with “ZZZZ”. We need to keep the time from logline starting with “ZZZZ” and add this time value to the upcoming logs. Keep this time value in memory and update the value when the next log event starting with “ZZZZ” comes up. For running Logstash configuration with aggregate filter plugin, we need to run Logstash in a single thread. If we use the same Logstash instance to handle other logs and nmon logs, it will be a burden to execute other logs also in a single thread. This will affect the performance of the entire system. To overcome this, we can use a different pipeline or even a different Logstash instance for the nmon log parsing and other log parsing. For multiple pipeline method, we can configure pipelines.yml as follows:
- pipeline.id: log-feeding-pipeline
  path.config: "LOGSTASH_HOME/config/logstashfornormallogs.conf"
  pipeline.workers: 4
- pipeline.id: single-threaded-pipeline
  pipeline.workers: 1
  path.config: "LOGSTASH_HOME/config/logstasfornmon.conf"
Filter configuration for “logstasfornmon.conf”:
filter {
  grok {
    match => {
      "message" => "%{WORD:identifier}"
    }
  }

  if [identifier] == "ZZZZ" {
    grok {
      match => {
        "message" => "%{WORD:},%{WORD:series},(?<log_time>%{HOUR}:%{MINUTE}:%{SECOND},[0-9]+-[A-Z]+-[0-9]+)"
      }
    }
    aggregate {
      task_id => "%{series}"
      code => "map['log_time'] = event.get('log_time')"
      map_action => "create"
    }
  } else if [identifier] == "MEM" {
    grok {
      match => {
        "message" => "%{WORD:},%{WORD:series}?,%{NUMBER:free_memory_percentage:float}?,%{NUMBER:free_virtual_memory_percentage:float}?,%{NUMBER:free_memory_mb:float}?,%{NUMBER:free_virtual_memory_mb:float}?,%{NUMBER:total_memory_mb:float}?,%{NUMBER:total_virtual_memory_mb:float}?"
      }
    }

    aggregate {
      task_id => "%{series}"
      code => "event.set('log_time', map['log_time'])"
      map_action => "update"
    }
  }

  date {
    match => [ "log_time", "HH:mm:ss, dd-MMM-yyyyZZ", "ISO8601" ]
    target => "log_time"
  }
}
In my next post, I will be discussing system metrics log monitoring with Metricbeat and the time duration calculation using elapsed and aggregate Logstash filter plugins.