

Any discussion on cloud portability must necessarily include an analysis of its challenges. More so, if the cloud-portable solution under consideration is a high-ingress one, which was our case. This post picks up from my previous article on cloud portability and provides you an in-depth view of the implementation, challenges, and solutions we found for those challenges. If you are new to this series, please jump to Part 1, which sets the context for this article.
Storage Partition
The platform under discussion processes millions of events in a short period. These events are then logged and stored in Azure Table Storage. The entire operation is managed by 32 consumers (Azure Functions) with a combined throughput of 1800 to 2000 events per second.
In a NoSQL storage system, such as Azure Table Storage, the partition key or strategy plays a major role in storage performance. This is especially true when extensive read-and-write operations are involved.
For optimal performance, we prioritized the following in our Table Storage design:
- Load Distribution: Designing the partition key to evenly distribute the load
- Hot Partitions: Ensuring no single partition becomes a bottleneck
- Feed Creation Performance: Balancing the partition count to prevent any adverse effect on the feed creation system (a decoupled batch process that reads data from all the partitions and creates feeds for downstream systems)
- Optimizing Writes: Prioritizing fast write operations without impeding the subsequent feed creation batch process
- Traceability and Checkpoints: Ensuring partitions are easily traceable by the feed creation system batch process, allowing for proper checkpoints to mitigate the risk of data loss
- Efficient Log Deletion: Designing logs to be short-lived and deletable after the feed creation process
As per this design, a table is automatically generated every hour with the logs for that specific hour. As events arrive across 32 Event Hub partitions, the Event Hub partition key received in the event is used as the Table Storage partition key. That is, the hourly table will have 32 partitions, and the data for that hour will be distributed across those partitions. For example, table “XXXX_Log_1000” with partition keys ranging from 0 to 31 will be created when logs are received at 10:00 UTC.
The above partition strategy should be fine for most cases, but in our use case, we had to further split the partitions in such a way that each consumer will internally create a counter (which is configurable) and distribute the data further to granular partitions. We set that counter as 100 for a large tenant and ended up with 3200 partitions in that hourly table in the following format: <eventhub_partition_number>_<counter> (e.g., 0_0, 0_1,...0_99,....,1_0,1_1,...,1_99,...........31_99)
The feed creation batch process invoked every hour will read the Table corresponding to the previous hour, loop through the partitions as the partition keys are predictable, create the feed file, and then invoke another process to delete the entire table.
Why an hourly table? Why not a single table with an hourly partition?
When everything is handled in the same table, it results in a resource-intensive batch delete operation—something we wanted to avoid. An hourly table makes deletion more straightforward.
When everything is handled in the same table, it results in a resource-intensive batch delete operation—something we wanted to avoid. An hourly table makes deletion more straightforward.
Distributed Circuit Breaking Strategy
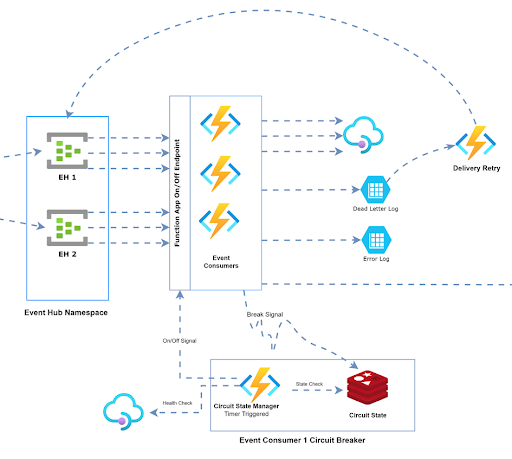
Ensuring platform resilience was a priority. To address this, we implemented a distributed circuit breaker—a safety feature designed to swiftly respond to downstream service outages. This mechanism directs all consumer instances to pause processing and later resume consumption once the downstream service is restored.
During peak load, our system handles 32 consumer instances, which read events from the Event Hub and transmit the data to a third-party API. The third-party API is expected to be consistently high-performing, yet there could be instances where it struggles with the high volume of incoming requests.
This is where a circuit breaker pattern becomes invaluable.
If implemented in the consumer functions, the circuit breaker can halt calls to the third-party API, providing it with some breathing room to recover. There is a challenge, however. Considering that consumers collectively handle 1800-2000 events per second (roughly 60 requests per second per consumer), an independent circuit-breaking setup for each consumer will introduce delays in identifying issues and breaking the circuit. Consequently, a substantial number of requests would be processed from the Event Hub and transferred to the dead letter box (custom implementation) before the circuit is effectively broken for all the consumers.
In an ideal scenario, the system should:
- Cease calling the third-party API as soon as any one of the consumers identifies a circuit-breaking scenario. The quicker this happens, the shorter the healing time required.
- Handle the situation gracefully, ensuring that events from the Event Hub are not processed until the third-party API is back up. The more events are dead-lettered, the more processing is needed for subsequent dead letter retries.
Custom Distributed Circuit Breaker
We designed a custom centralized circuit-breaking manager for this purpose, along with the individual circuit-breaking setup for every consumer. We didn't create a circuit breaker from scratch since there are plenty of handy libraries out there. In our application, we went with Opossum.
This is what happens with our custom circuit-breaking manager:
- The Opossum implementation in the individual consumer functions will notify the circuit-breaking manager the moment it identifies an open circuit state.
- The circuit-breaking manager will then initiate a full shut-down of the Azure Function app so that:
- No new events are consumed from the Event Hub.
- The consumer instances processing the batch of events are killed so that the checkpoint writing fails. Hence, these events can be reprocessed when the consumer resumes operation.
- The circuit-breaking manager will also invoke recurring health check hits at specific intervals to check the health of the third-party API.
- When the circuit-breaking manager confirms the API is up and ready to be consumed, it starts the Azure Function App so that the consumers can start reading the events from the last checkpoint.
SNAT Port Exhaustion Issue
While conducting load tests to simulate the anticipated load of 4-6 million requests within a 20-minute window, we faced an unexpected slowdown in the overall message consumption. All services seemed to be operating smoothly, showing no significant spikes in CPU or memory usage, and there were no exceptions logged. However, despite these health indicators, the system exhibited a noticeable slowdown.
At first, we suspected the third-party API to be the cause of the slowdown, but closer investigation revealed something else. We were not hitting the “actual” third-party API but a high-performing mock API of our own that effectively mimicked the third-party API's behavior for load-testing purposes, ensuring we could conduct tests without incurring excessive billing per hit. The performance statistics of our mock API were excellent, confirming that there were no issues with that API. Despite thorough optimizations in every possible path and multiple checks on operations before and after the API call, no performance improvements were found.
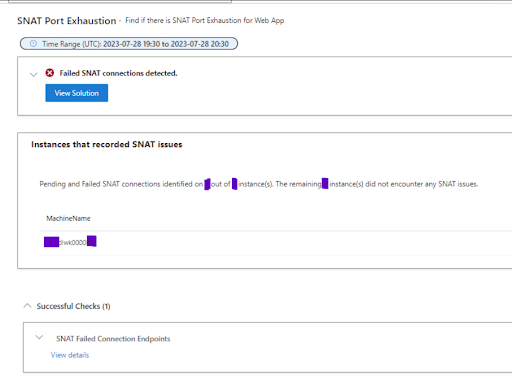
Then it struck us: SNAT Port Exhaustion! A quick check of the App Service Plan -> Diagnose and Solve Problems -> Availability and Performance -> SNAT Port Exhaustion section confirmed our suspicions. We were indeed hit by SNAT Port exhaustion, which was causing the slowdown.
Further investigation revealed that the HTTP client package we were using wasn't handling connections properly. We tried numerous configurations, but none were satisfactory.
Finally, we decided to develop a simple HTTP client package tailored to our specific needs. This new package efficiently reused connections, and with features like configurable retry and exception handling, the results were remarkable. Message consumption resumed at a significantly higher rate, and our application began processing them seamlessly, like a charm.
CIDR Block Size and Premium Azure Function Scaling Issue
We encountered another challenge related to scaling the Premium Azure Function app. Despite our efforts in configuring Event-driven scaling or Target-based scaling, the number of instances scaling up was consistently limited to just 10. Considering we had 32 partitions in the Event Hub and a significant influx, the optimal number of Azure Function instances at peak should have been 32. Unfortunately, the scaling was capped at a mere 10 instances, causing an overall slowdown in the processing.
The root of the issue lay in the subnet capacity, which had a limited amount of addresses. The CIDR block size was set to /28, resulting in a restricted number of available addresses. The maximum number of available addresses in /28 CIDR block size was just 11 (see table below), but we needed more!
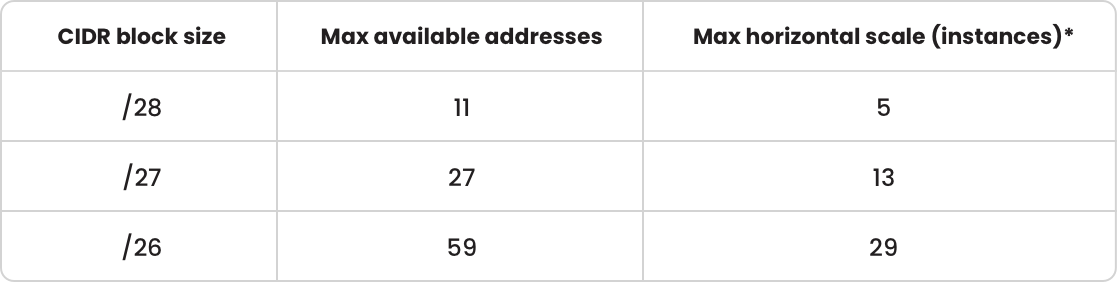
The scaling of the Azure Function began functioning as anticipated after modifying the configuration to employ a /26 CIDR block size!
Optimizing Concurrency Configuration to Manage High CPU Utilization
Our challenges were not over. The process of creating feeds, managed by Service Bus trigger Functions, was taking significantly longer than anticipated. The CPU utilization of the App Service Plan remained consistently high, hovering around 95 percent throughout the entire execution period.
We traced the root cause to the default handling of concurrent requests by the function. While a higher number of concurrent requests might speed up operations, we realized it's crucial to exercise finer control, especially for CPU/Memory-intensive tasks.
To address this, we adjusted the MaxConcurrentCalls parameter of the ServiceBus configuration to a lower value. This strategic modification helped strike a balance between the overall execution speed and CPU utilization.
Conclusion
Our experience in fine-tuning the system for heavy-duty tasks highlights how small changes can have a big impact. Simple tweaks, like using caching and proper lifetime scope for the objects, might seem small, but they can significantly boost the system's performance. Even minor shifts in cryptographic algorithms can make a noticeable difference. These little improvements worked together to take our system's performance to a whole new level.
In the world of handling massive amounts of data, it's crucial to understand that problems like the SNAT port issue we discussed may not be a big deal in regular applications. However, when dealing with a ton of data, every detail counts, and fixing even the smallest things can lead to major improvements in how well the system runs. This journey showed us that paying attention to the little things and always looking for ways to make things better is key to getting the best performance in high-pressure situations.
Need a sound engineering team to smoothen your cloud journey? Send us a brief description of what you're dealing with!
Additional Resources