

In my previous post, I had discussed the basic architecture and features of Elastic Stack-based log monitoring system. Here, I delve into three use cases of Elastic Stack, namely, response time calculations, system metrics monitoring, and alerting.
Response Time Calculations
Response time is a crucial indicator of a service application’s performance. The response time is sometimes readily available in the log message itself. In such cases, it is pretty easy to track the response time.
2019-07-12 22:03:03:681 [INFO] ( com.qburst.app.monitor.logs, Monitor DEBUG, ID:414d1916585a305a19164749202020203f73885a3b1bc1916 ) MonitorAdapter.getUserMasterData executed in 494 ms with parameter list: user:u15320;
For example, from the above logline, we can easily identify the service name and execution time. Then we can create visualizations based on the execution time and monitor variations in the execution time behavior. When the execution time is not directly available, we can calculate the execution time from the start and end logs using the elapsed filter plugin or aggregate filter plugin.
Response Time Calculation Using Elapsed Filter Plugin
The elapsed filter plugin tracks a pair of log messages with a specific start/end tag to calculate the elapsed time. Let’s consider the following example. The two log messages given below show the start and end of user details fetch operations. There are identifiers for the start and end of the operation and there is a unique id for the operation.
2019-07-12 01:23:38.062 [INFO] (com.qburst.app.monitor.logs, UDFO_110, 414d5121915a425a30303431191620205cd6f3762c651916)   19.3.1.2 User details fetch operation start QBMONUser: qburst_tec_user_sup PutDateTime: 20190711-232338

2019-07-12 01:23:41.443 [INFO] (com.qburst.app.monitor.logs, UDFO_120, 414d5121915a425a30303431191620205cd6f3762c651916)   19.3.1.2 User details fetch operation end QBMONUser: qburst_tec_user_sup
- Run Logstash in single thread. To do that, update your logstash.yml and set pipeline.workers: 1. Or start Logstash with the following command (-w 1 command line argument is for setting pipeline workers to 1):
./bin/logstash -f logstash.conf -w 1 - Check that the elapsed filter plugin is installed. Installed filter plugins can be listed using the below command.
./bin/logstash-plugin list --group filter
If logstash-filter-elapsed is not found in the list, you need to install elapsed filter plugin. To do this, execute the following command from the Logstash installation directory:
./bin/logstash-plugin install logstash-filter-elapsed - Configure logstash. Update the logstash.conf filter section as shown below. As per the log messages given above, we have the start tag UDFO_110 and end tag UDFO_120.
Filter {
grok {
  match => {
    "message" => "%{TIMESTAMP_ISO8601:log_time} \[%{LOGLEVEL:log_level}\] \(%{DATA:logger_name}, %{GREEDYDATA:execution_context}, %{GREEDYDATA:execution_id}\)\s*%{GREEDYDATA:log_message"
    }
  }
  elapsed {
    start_tag => "UDFO_110"
    end_tag => "UDFO_120"
    unique_id_field => "execution_id"
    timeout => seconds
  }
}
The elapsed filter plugin collects all the start events for a unique execution_id. If more than one start event occurred for the same execution_id, then keep the first event only (we can configure to keep the last event also by setting keep_start_event property to last). Here, the start event is the log message with the UDFO_110 tag. Elapsed plugin saves the event details of this start event and waits for the corresponding end event (Log message with UDFO_120 tag and the same execution id of the start event). Upon finding a matching start and end event, the elapsed plugin calculates the time difference between these two log messages in seconds. It creates a new field named elapsed_time and stores the calculated time difference.
Logstash keeps a tags array attribute to hold values. Elapsed plugin adds some tags and fields to the event as follows.
Fields
elapsed_time: Field in the end event with the elapsed time in seconds.
elapsed_timestamp_start: Field in the end event with the timestamp of the corresponding start event.
Tags
elapsed: Add tag elapsed to both the start and end event.
elapeed_match: Add tag elapsed_match in the end event.
From the above log messages, this configuration adds the following information in the end event.
"elapsed_timestamp_start": "2019-07-12 01:23:38.062Z"
"elapsed_time": 3.381
"tags": ["elapsed", "elapsed_match"]
Response Time Calculation Using a Combination of Plugins
Elapsed filter plugin has some limitations. It works only based on the @timestamp field for response time calculation. It will be difficult when we have a custom time field or multiple time fields. In one of our projects, we had to keep @timestamp field as well as log_time field, the time parsed from the log message. To get accurate response time, we need to calculate the time difference of log_time field. Also, the elapsed filter plugin can track only one pair of log events for response time calculation.
The solution is to use both aggregate filter plugin and ruby filter plugin. We can use the aggregate filter plugin to collect information from multiple events and push the aggregated information to the final event in case of related log events. And the ruby filter plugin can be used for some inline ruby code executions. Sample configuration to calculate the elapsed time is given below.
filter {
  grok {                     //Parsing the log message -- 1
    match => {
     "message" => "%{TIMESTAMP_ISO8601:log_time} \[%{LOGLEVEL:log_level}\] \(%{DATA:logger_name}, %{GREEDYDATA:execution_context}, %{GREEDYDATA:execution_id}\)\s*%{GREEDYDATA:log_message"
    }
  }
  // date filter to parse date time from field log_time -- 2
  date {
    match => [ "event_time_CLUSTER_REQ_001", "ISO8601" ]
    target => "log_time"
  }
  // Checking for start event  -- 3
  if [execution_context] == "UDFO_110" {
    aggregate {           // Aggregate filter for start event -- 4
      code => "map['start_time'] = event.get(log_time)"
      map_action => "create”
      task_id => "%{execution_id}"
    }
  // Checking for end event  -- 5
  } else if [execution_context] == "UDFO_120" {
    aggregate {         // Aggregate filter for end event -- 6
      code => "event.set('start_time', map['start_time'])"
      map_action => "update”
      task_id => "%{execution_id}"
    }
  }

  if [start_time] {
    ruby {      // ruby filter to calculate the time difference -- 7
      init => "require 'time'"
      code => "
        if event.get('log_time') != nil &&
           event.get('start_time') != nil
             event.set('elapsed_time', (event.get('log_time') -
             event.get('start_time')))
        end"
    }
  }
}
Now let me break down the steps involved in configuring Logstash.
- Parse the log message into various fields named log_time, log_level, logger_name, execution_context, execution_id, log_message using the grok filter.
- Parse date from log_time field using the date filter.
- Check availability of the start event by checking the execution_context field.
- Create a map with execution_id as task_id and log_time as start_time using aggregate filter.
- Check availability of the end event by checking the execution_context field.
- Fetch the start_time from the aggregate map you already saved from the start event. Then save it to the end log event field using aggregate filter.
- Calculate the time difference of log_time of the end event and start_time. Then save this time difference in the elapsed_time field of the event using the ruby filter.
With the generated elapsed_time field, we can create Kibana visualization as seen below. It shows the average elapsed_time value against time. In the case below, the average response time is high between 08:53:00 and 08:55:00.
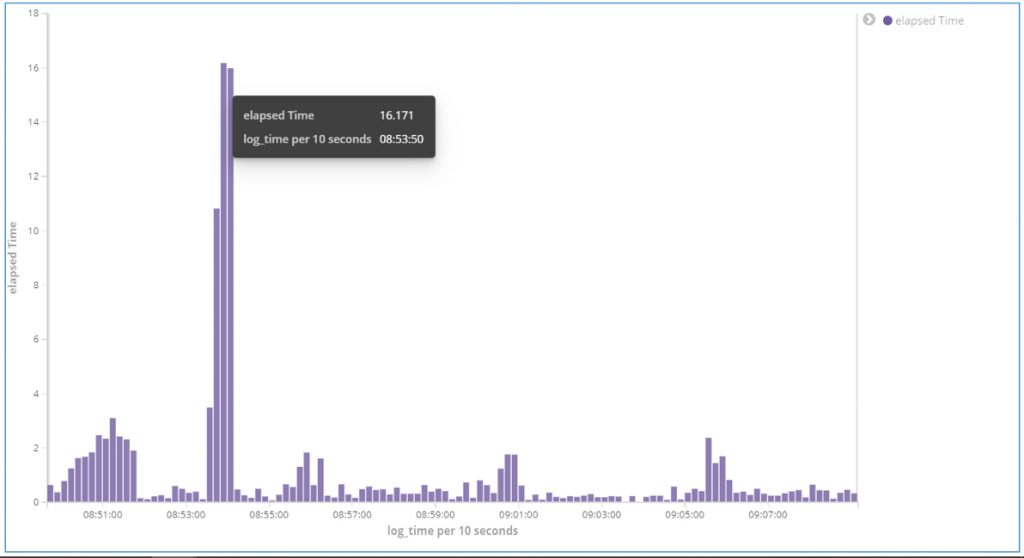
Fig 1. Average response time graph.
Monitoring System Metrics
Another important use case for Elastic Stack is monitoring system metrics. System metrics help us to understand the state of the infrastructure, that is, how reliable and stable it is. We can monitor system resource availability, usage, and exhaustion. Elastic provides a tool to collect system metrics—Metricbeat. Metricbeat collects data from systems and services like Apache, AWS, Docker, and Kafka and ships the data to Logstash or Elasticsearch index.
Let’s look at metricbeat.yml configuration.
metricbeat.modules:
#------------------------- System Module -------------------------
- module: system      # Defining system metrics module

  Metricsets:         # Specifying the required system metrics
    - cpu             # CPU usage
    - filesystem      # File system usage for each mountpoint
    - fsstat          # File system summary metrics
    - memory          # Memory usage
    - network         # Network IO
    - process         # Per process metrics
    - process_summary # Process summary
    - uptime          # System Uptime
  enabled: true
  period: 30s
  processes: ['.*']

  cpu.metrics:  ["percentages"]

#==================== General =========================
name: qb_metric

#======================== Dashboards ===============================
setup.dashboards.enabled: true

#======================== Kibana ===============================
setup.kibana:
  host: "localhost:5601"

#========================== Outputs ===============================
#-------------------- Elasticsearch output ------------------------
Output.elasticsearch:      # For saving data to elasticsearch index.
  # Array of hosts to connect to.
  enabled: true
  hosts: ["localhost:9200"]
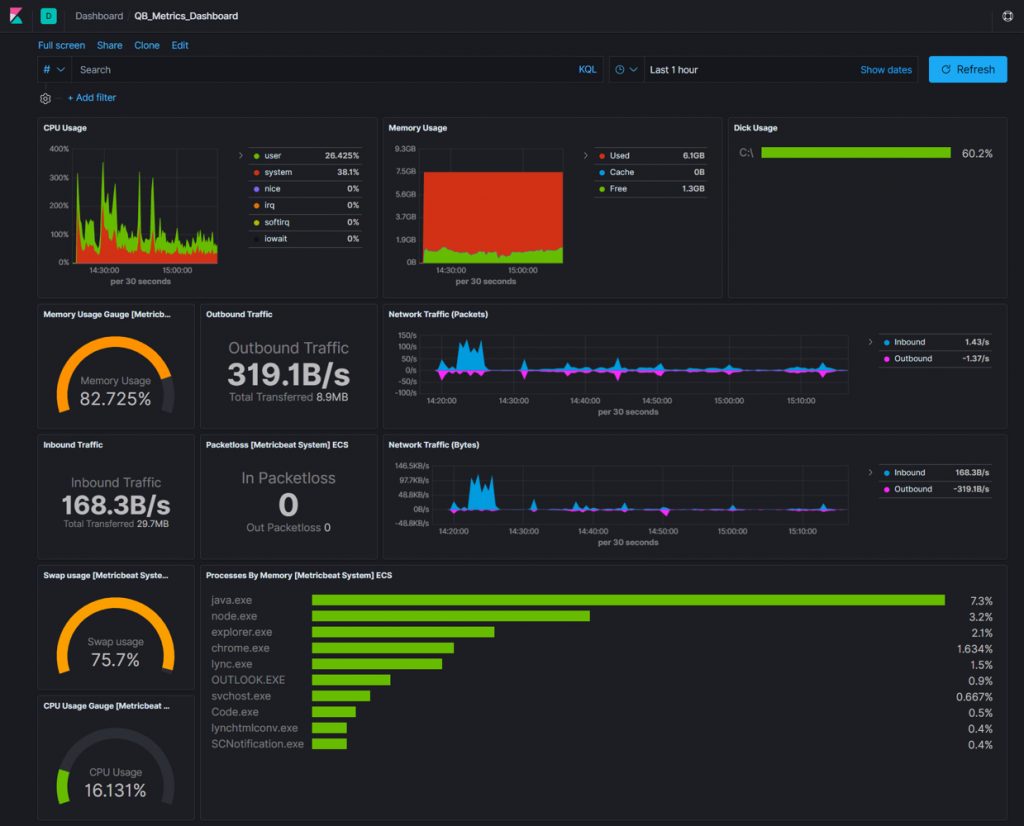
This configuration handles the basic system metrics data collection and transfer. This includes metrics related to CPU, memory, file system, network, process, and uptime of the installed system every 30 seconds. It then sends the data to Elasticsearch for storage. We can transfer the data directly to Elasticsearch index or via Logstash. Here we are directly transferring the metric data to the Elasticsearch. The metric data will be saved in an index named metricbeat-version-date. For example, the above metricbeat configuration will create an index metricbeat-7.4.2-2020.01.25. Metricbeat creates some helpful visualization and dashboards for us. To access this feature, you must set the configuration property setup.dashboards.enabled to true.
Alerting
Another very useful feature of Elastic Stack-based log monitoring system is Alerting. In case of vulnerabilities like higher CPU usage, free disk space getting reduced, higher response time, lower load for certain indices, the system can notify you, enabling quick action.
Elastic Stack can alert you through email, PagerDuty, Slack, and HipChat. It also allows you to integrate custom or third-party solutions with the help of Webhook action. Elasticsearch provides watcher, using which you can create alerts based on certain conditions. However, you need an X-Pack license to work with Elastic watcher.
There are two types of watchers:
- Threshold Alerts
- Advanced watch
Let me explain the working of threshold alerts and advanced watcher configuration with email action.
Configuring Threshold Alert
Threshold alerts are used to monitor whether the data in indices is above, below, or equal to the threshold value in a given time interval. Kibana provides a helpful UI to create threshold alerts. To create threshold alert, configure the properties as follows:
- Name: Watcher name.
- Index: List of indices to check.
- Time field: Field to be considered for time calculations.
- Interval: Time interval to trigger the watch.
- Aggregation type: Count, average, min, max, sum. For count, aggregation is the document count. Other aggregations can be added only in numeric fields.
- Aggregation field: Refers to the fields that can be aggregated. For count aggregation, there is no need to select the field. For other aggregations, we need to specify a numeric field to which aggregation is to be applied. Aggregations work either for all documents or top n values for the selected field.
- Aggregation target: Aggregation target specifies where to apply these aggregations. We can select aggregation-target as either over all the documents or over top n values of the selected field. If we select all documents, then the search is done over all the documents. If we select top n, then it will group the data based on the field and condition will be worked under this context.
- Condition: To define the condition.
- Action: To define the action.
Let us create a threshold alert to trigger an email when the average response time is greater than five seconds and trigger this watcher every five minutes. The configuration for this watcher is captured in the below image.
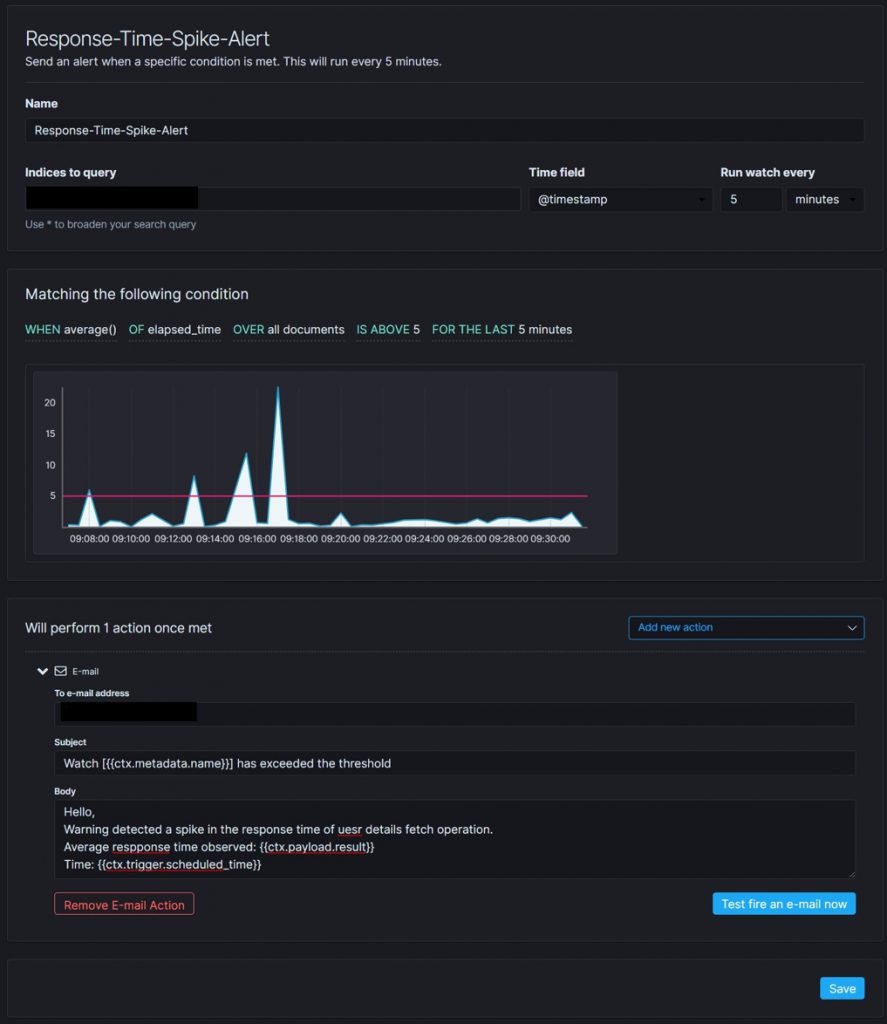
Fig 3. Threshold alert configuration sample
Open up Kibana. Select Management → Elasticsearch → Watcher. Then click Create threshold alert link. Kibana will open the create threshold alert page. Provide the details as mentioned in the sample configuration image and save.
Fig 3. shows how to configure a threshold alert to trigger the email notification when response time spikes.
- Provide a name for the watcher
- Provide the index name
- Select the @timestamp field for the time field
- Set the interval as 5 minutes
- Select average as aggregation type
- Select elapsed_time as aggregation field
- Select all documents as aggregation target
Kibana will generate a graph as per your configurations. Finally, you need to define the email action. For creating an email action, select Add new action and select Email. Fill the recipient email address, subject and, body of the email. You can use the mustache template to use the values of the watcher in the email subject and the email body.
Configuring Advanced Watcher
Advanced watcher is helpful when you have to use custom search or aggregation or scripts to identify vulnerabilities. To create and configure advanced watcher, you need to generate a JSON request with five sections—trigger, input, transform, condition, and actions. Kibana will generate a default structure of the watch definition JSON request, which can be customized to the use case.
Let us create an advanced watcher to trigger an email when the log message threshold is greater than a particular limit. Currently, we have an elasticsearch index named qb_elapsed to store the response time log events. Assume the expected log events per minute for this index is 1000. We need to trigger an email when the threshold is higher than this limit. To create such a watcher, follow the below steps.
Open up Kibana. Select Management → Elasticsearch → Watcher. Then click Create advanced watch button. Kibana will open the New watch page. Provide the ID and Name of the Watcher. Specify the watch definition in JSON format.
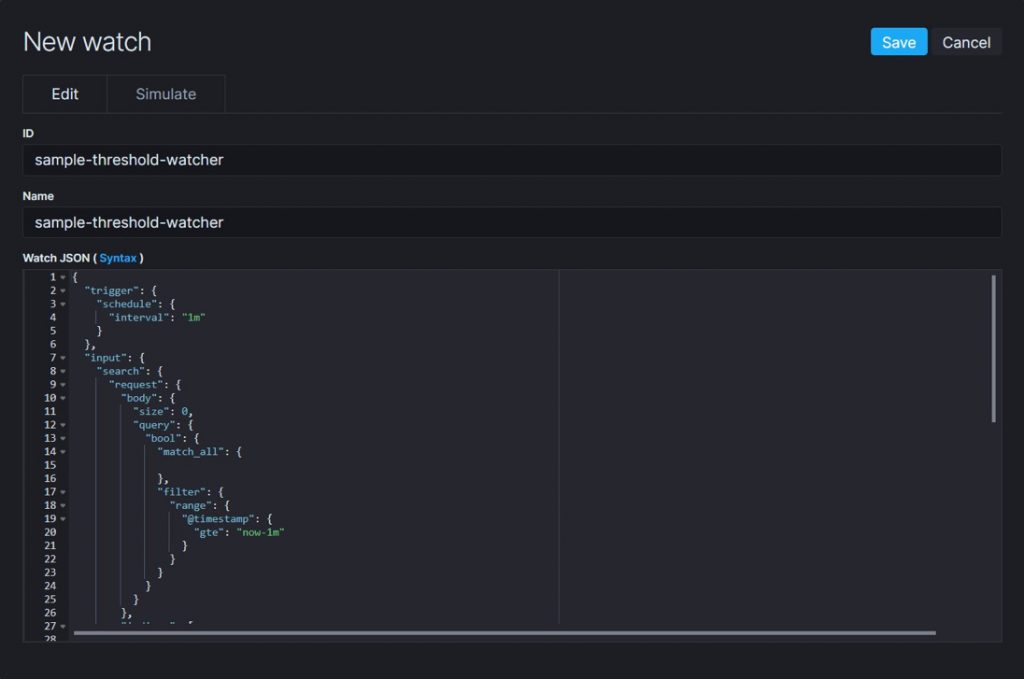
Advance watcher configuration sample
Watch JSON (Watch definition)
We need to provide a watch definition JSON request to create an advanced watcher. I have provided a sample watch definition here.
{
  "trigger": {
    "schedule": {
      "interval": "1m"
    }
  },
  "input": {
    "search": {
      "request": {
        "body": {
          "size": 0,
          "query": {
            "bool": {
              "must": [
                  {"match_all": {

                }}
              ],
              "filter": {
                "range": {
                  "@timestamp": {
                    "gte": "now-1m"
                  }
                }
              }
            }
          }
        },
        "indices": [
          "qb_elapsed*"
        ]
      }
    }
  },
  "condition": {
    "compare": {
      "ctx.payload.hits.total": {
        "gte": 1000
      }
    }
  },
  "actions": {
    "threshold-mailer": {
      "email": {
        "to": [
          "sudheesh@qburst.com"
        ],
        "subject": "Threshold Alert",
        "body": {
          "html": "<html><head><meta name='viewport' content='width=device-width'/><meta http-equiv='Content-Type' content='text/html; charset=UTF-8'/><title>Threshold Alert</title></head><body><h3>Threshold Alert</h3><br/><p>Hello There is higher threshold encountered.<br/> Threshold: {{ctx.payload.hits.total}}</p></body></html>"
        }
      }
    }
  }
}
Watch JSON (Watch definition) has five sections:
- Trigger: Defines when to execute the watcher. We can schedule the watcher trigger for any time interval. In this example, the trigger has been scheduled for one minute.
- Input: Defines the data to be loaded into the watch payload. There are four types of watcher inputs:
- Simple (static data)
- Search (elasticsearch search query)
- Http (response of the http request)
- Chain (uses a series of inputs to load the data)
Here, I have used the Search input. The search query used in the above watch definition fetches all the data from elasticsearch index qb_elapsed* and for the last one minute. The watch payload contains the search response. We can access this payload using {{ctx.payload}}.
- Condition: Defines the condition for triggering alerts. Here, I have used the compare condition, to compare the hits.total of watch payload with the expected load 1000 as given below.
"condition": {
	"compare": {
		"ctx.payload.hits.total": {
			"gte": 1000
		}
	 }
 }
- Transform: To process and modify the watch payload with the help of some scripts. It's an optional part. For example, the search query result is very large and we only need the hits.total value. We can use a transform script to filter the search result and extract the required value only.
"transform" : {
    "script" : "return [ 'total_hits' : ctx.payload.hits.total ]"
}
Use the above transform script in the watch definition, and then access the total_hits value.
"condition": {
"compare": { "ctx.payload.total_hits": { "gte": 1000 } }
 }
- Actions: Defines the actions to be performed when the watcher condition is met. Here, I have defined an email action with the name threshold-mailer. It will trigger emails to the specified email id.
Conclusion
My two blog posts only briefly touch upon some basic use cases of Elastic Stack. You can read about the Elastic Stack-based analytics project we implemented for the R&D wing of a leading automobile company here. For more details on our capabilities and approach, check our application performance monitoring services and cloud monitoring services.